
Page 4 - 2024 California Coast Credit Union Annual Report
P. 4
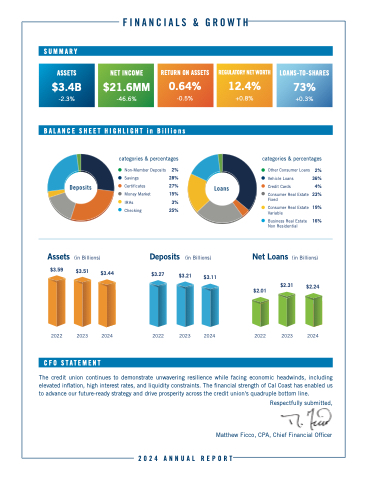
   SUMMARY
ASSETS
$3.4B
-2.3%
BALANCE SHEET HIGHLIGHT in Billions
LOANS-TO-SHARES
73%
+0.3%
categories & percentages
Other Consumer Loans 2%
Vehicle Loans 36%
Credit Cards 4%
Consumer Real Estate 23% Fixed
Consumer Real Estate 19% Variable
Business Real Estate 16% Non Residential
  NET INCOME
$21.6MM
-46.6%
RETURN ON ASSETS
0.64%
-0.5%
REGULATORY NET WORTH
12.4%
+0.8%
   categories & percentages
Non-Member Deposits 2% Savings 28% Certificates 27%
    Money Market IRAs Checking
15% 3% 25%
   Assets (in Billions)
Deposits (in Billions)
Net Loans (in Billions)
$3.59
2022
$3.51
$3.4 4
$3.27
$3.21
$3.11
2024
  $2.31 $2.01
$2.24
          2023 2024
2022 2023
2022
2023 2024
 CFO STATEMENT
The credit union continues to demonstrate unwavering resilience while facing economic headwinds, including elevated inflation, high interest rates, and liquidity constraints. The financial strength of Cal Coast has enabled us to advance our future-ready strategy and drive prosperity across the credit union's quadruple bottom line.
Respectfully submitted,
Matthew Ficco, CPA, Chief Financial Officer
 2024 ANNUAL REPORT
